
What are Level Based Measures?
For all my new readers I would like to first explain what is a Measure. A Measure is any measurable entity and aggregation functions can be applied on them. In other words any entity which is viewed/compared with respect to dimension columns is a measure. eg: Total Sales, Dollar Amount are measures which can be viewed against Time, Region Dimensions.
Now, Level Based Measures as their name state are calculated at a particular level. It can be better understood with the following example:
Lets assume there is a company ABC which has its Sales extended in many regions, countries and cities. Now, the CEO of the company wants to see the Total Sales at Country Level(Western Region has US and Canada as countries) i.e. one level below Region and one level above Cities. So, here our measure Sales has to be summed up to the Country level. Similarly, the same Sales measure can be viewed against Time Dimension at any particular level. Eg: Quarterly Sales.
These type of measures are called the Level Based Measures.
How are Level Based Measures created?
Before understanding how is it created we have to understand the concept of Dimension Hierarchies.
A Dimension Hierarchy is basically a drilldown(from top to detail) of a dimensional attribute. As explained in my previous example (company ABC), while analyzing Total Sales against Region Dimension we saw three levels of Region Dimension, the topmost level was Region, the second was Country and the last was City. These 3 levels will become the levels of our Dimension Hierarchy across which the Total Sales can be viewed. Similarly, the Time Dimension can have Total, Year, Quarter, Month and Date as its levels.

The Dimension Hierarchy is created in the BMM Layer in the OBIEE RPD and based on it we can decide at which level of a particular dimension do we actually need to see the measure.
Now again coming back to our question How are Level Based Measures Created. Once the Time Dimension Hierarchy is created, we need to set the content level of the Total Sales measure to a particular level(present in the Time Dim Hierarchy) to make it a Level Based Measure. This can be done by double clicking on the Total Sales column and then setting the level in the Levels tab. The setting of content level can be better explained by the below image.

How do Level Based Measures Work?
When we dont set any level in the RPD for Total Sales measure and create a report with columns Per Name Year and Total Sales, we get the below output. The Total Sales is aggregated at the Year level.

But after setting the content level at Month in the RPD, if we run the report, then the report will show the Total Sales at Month level and the data doesn’t get aggregated at the Year Level. In the below image you can see 12 records for year 2008.

Another interesting thing to note with Level Based Measures is that when we drill below the Month Level in the report, the values for corresponding measure keeps on repeating, restricting the users drilling capabilities below Month Level. This can be understood by the below images.

The above image shows the drill from year to month level. Please note that the Total Sales corresponding to Per Name Month 2008/01 is 43810.

The above image shows the drill from Month Level to the Week Level. But the values for Total Sales column remain the same as in the previous image even after drilling to a lower level restricting the users from viewing the detail data.
This can also be used for security restricting the inappropriate users from viewing the detail data.
This is all about the Level Based Measures. I hope it helps you to understand the basic logic behind using them.
Level Based Measure in OBIEE in 10g
A level-based measure is a column whose values are always calculated to a specific level of aggregation. For example, a company might want to measure its revenue based on the country, based on the region, and based on the city. You can set up columns to measure CountryRevenue, RegionRevenue, and CityRevenue.
To set up these calculations, you need to build a dimensional hierarchy in your repository that contains the levels Grandtotal, Country, Region, and City. This hierarchy will contain the metadata that defines a one-to-many relationship between Country and Region and a one-to-many relationship between Region and City. For each country, there are many regions but each region is in only one country. Similarly, for each region, there are many cities but each city is in only one region.

Right click on the fact table -> New Object -> Logical Column.

Then, Give a name to the measure, then under Aggregation tab, select the appropriate aggregation rule(SUM is the Aggregation for the measure CountryRevenue, in my case), then under the Level tab, select the appropriate logical level (country is the logical level for the measure CountryRevenue, in my case). Then say OK.

Repeat the same process for the other tow measures (RegionRevenue, and CityRevenue).
Now map the these logical measures to the physical source (Revenue is the physical source for these measures in my case.) To map the column CountryRevenue to the physical source column Revenue, follow the below steps :
Double click on the measure, called CountryRevenue, goto Data Type.You will find the logical Table source, double click on it.

Uncheck the option Show Mapped Columns, then all the unmapped columns will be displayed. In our case CountryRevenue,RegionRevenue, and CityRevenue are the unmapped columns. So, you should be able see all these columns there.

Now click on the dotted button (highligted in above picture) beside the measure CountryRevenue to map to physical source column. Then select the appropriate phisical source column from the Expression Builder and say OK.

Repeat the same procedure for other two columns.
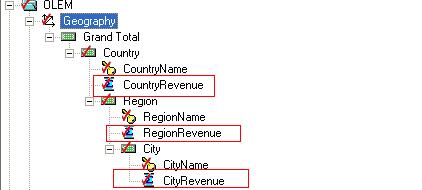
Final step is, make sure that all the three measures should be listed under the corresponding logical Level in the dimension. In my case, the CoutryRevenue must listed under Country logical level, RegionRevenue must listed under Region logical level, CityRevenue must listed under City logical level in the dimension Product.

These measures are specific to the defined logical level. So CountryRevenue measure will always gives us the Revenue to the Country level, even if you add the Region dimension column in between Country and CountryRevenue columns. RegionRevenue measure will always gives us the Revenue to the Country level, even if you add the City dimension column in between Region and RegionRevenue columns.CityRevenue measure will always gives us the Revenue to the City level.
Final step is, make sure that all the three measures should be listed under the corresponding logical Level in the dimension. In my case, the CoutryRevenue must listed under Country logical level, RegionRevenue must listed under Region logical level, CityRevenue must listed under City logical level in the dimension Product.
These measures are specific to the defined logical level. So CountryRevenue measure will always gives us the Revenue to the Country level, even if you add the Region dimension column in between Country and CountryRevenue columns. RegionRevenue measure will always gives us the Revenue to the Country level, even if you add the City dimension column in between Region and RegionRevenue columns.CityRevenue measure will always gives us the Revenue to the City level.
No comments:
Post a Comment