
Switching Between Multiple Reports In Oracle BI 11g
Dashboard prompts are used for filtering data values in reports, but here is one more functionality of dashboard prompt that is, you can also use it to switch between multiple reports. I will show switching between reports without using any intermediate report. So I am using 3 reports which I want to switch using dashboard prompt which are Analysis A, Analysis B, and Analysis C. Here is an example along with the steps:
Ø Step I: Create a Dashboard Prompt with the intended reports as a data value (Analysis A, Analysis B, and Analysis C) to be selected.


1. Click on New->Dashboard Prompt->select any subject area.
Note: It will not affect on our dashboard prompt as we have to create presentation variable of our choice.
2. Definition Pane for dashboard prompt will open. Now select “Variable Prompt” as below.

3. Now “New Prompt” dialogue will open. Create presentation variable as PV,label it as Select Report and select User Input as Choice List.

4. In Choice list Values click on plus (Green Icon) sign; it will display “Enter New Value” dialogue. Now manually enter the names of the reports which you want to display in prompt. Here I will put my three report names which I want to display as a list in dashboard prompt which are Analysis A, Analysis B, and Analysis C as below :

5. Now expand the Options. In “Default Selection” you can give any report name which you want to display by default on dashboard by selecting that report name as “Specific Custom Value”. Here I have given “Analysis A” as my default selection.

6. Now save your dashboard prompt. In this way our dashboard prompt is ready from selecting reports which will look like :

Ø Step II: Create reports which you want to display according to selected report name in dashboard prompt.
1. I am taking some columns in reports plus one dummy column. I have change the column formula of Dummy column as:
CASE '@{PV}' WHEN 'Analysis A' THEN '1' ELSE '0' END

2. Now I have applied filter on Dummy Column as “is not equal to /is not in” ‘0’.

3. After changing column formula of Dummy Column and applying filter I have hide the dummy column by clicking on Column Properties > Column Format > Checked “Hide” checkbox. We can also delete the Dummy Column but make sure filter on that dummy column is important. Follow the same process in the rest two reports by slightly changing its column formula and filter based on the reports.
4. In “Analysis B” I have changed the column formula of Dummy Column and applied filter as :
CASE '@{PV}' WHEN 'Analysis B' THEN '1' ELSE '0' END

5. In “Analysis C” I have changed the column formula of Dummy Column and applied filter as:
CASE '@{PV}' WHEN 'Analysis C' THEN '1' ELSE '0' END

In this way we have done with creating all the three reports with intended filters.
Ø Step 3: Putting dashboard prompt and three reports in Dashboard by applying certain conditions on each sections in “Edit Dashboard”.
1. In “Edit Dashboard” I am first putting dashboard prompt and then all the three reports as below:

Note: Put all the reports and dashboard prompt in separate sections as we have to apply the condition on section.
2. Now I am applying condition in section of “Analysis A” by clicking on Properties > Condition > Section Condition as below :

3. For the section of “Analysis B” I am defining condition as:

4. And finally for the section of “Analysis C” I am defining condition as:

5. Now save your dashboard page and run it.
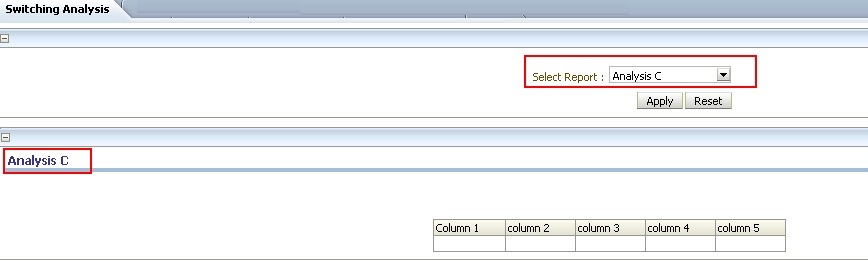
6. Here “Analysis A“is my default report so it is visible on my dashboard by default. Now whatever options (report name) you will select from prompt those report will be shown. It is not necessary to show one default report; you can remove default selection from dashboard prompt.
7. It will work as :


No comments:
Post a Comment